Canvas Tutorial: Quadratic Curve and Demo
Canvas offers two powerful functions for drawing curves - quadraticCurveTo and bezierCurveTo.
In the previous chapter, we saw how to draw a line at Canvas. But this is for a straight line. There are two methods for drawing a curve:
1) A quadratic curve, which is a parable, so an asymmetric arc is possible, has only an inflection point.
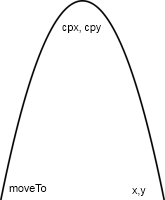
The start point is set via moveTo (x, y).
The center of the curve depends on the control point cpx, cpy.
The point of arrival is x, y.
2) The Bezier curve is a combination of arcs, it has at least two inflection points.
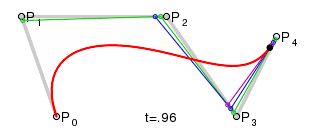
P0 is the entry point specified for moveTo (x, y).
P1 - checkpoint cpx1, cpy1.
P2 is implied.
R3 - checkpoint cpx2, cpy2.
p4 is the endpoint of x, y.
It is easier to chain curves, such as waves on water with the Bezier function. A tree branch may take the form of a parable as a quadratic curve or a double curve depending on the Bézier function.
For this demonstration, the quadratic curve principle will be used, and it will be drawn with the quadraticCurveTo function.
The plot depends on three points: The starting point, the control point denoting the outer limit reached by the curve, and the end point. The shape of the curve depends on the ratio of these three points .
The complete syntax for obtaining a curve requires three functions:
- beginPath starts a new curve.
- moveTo is the start point of the path.
- quadraticCurveTo has two pairs of arguments: checkpoint ctx, cty, where the curve direction changes, and endpoint x, y .
You can specify color and thickness with the same features you have already used to draw a straight line:
- strokeStyle: Color .
- lineWidth is thickness .
Display
.Full source code:
<canvas id="canvas1" width="400" height="150" style="border:1px solid #CCC">
</canvas>

<script>
var canvas = document.getElementById("canvas1");
if (canvas.getContext)
{
  context = canvas.getContext('2d');
}

function drawCurve()
{
  context.beginPath();
  context.strokeStyle='red';
  context.lineWidth=4;
  context.moveTo(20,100);
  context.quadraticCurveTo(200,10, 300, 100);
  context.stroke();
}

drawCurve();

</script>
To see how the function uses coordinates, we also placed black points to the three coordinates used to draw the curve...
function drawDot(x, y)
{
  context.beginPath();
  context.fillStyle='black';
  context.arc(x, y, 4, 0, 2 * Math.PI, true);
  context.fill();
}
drawDot(20, 100);
drawDot(200, 10);
drawDot(300, 100);
Therefore, it can be seen that the curve does not reach through the control point, the algorithm draws two imaginary straight segments, and then the curve inside these two segments, without exceeding them.
As well as...
- To more accurately draw curves with multiple inflection points, you can use a micro-framework like Smooth.js. An interactive demonstration shows how to convert lines to curves.